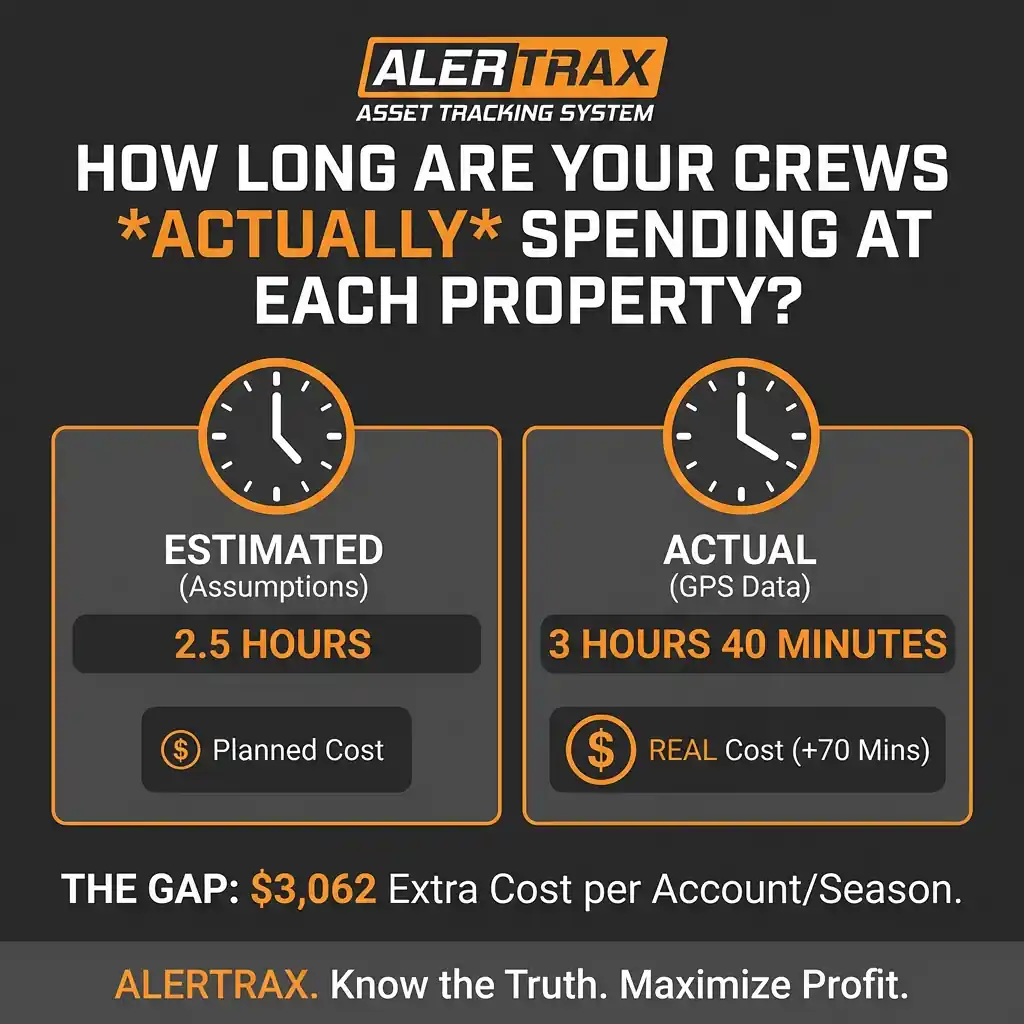
You bid a weekly maintenance property at 2.5 crew-hours per visit. Three guys, in and out in about 50 minutes. Mow, edge, blow, gone. You priced the account based on that number, the client accepted, and you have been servicing it every Thursday since April.
But here is what you do not know: your crew is actually spending 3 hours and 40 minutes at that property every week. They are arriving 10 minutes late because they stop for gas on the way. They are spending an extra 20 minutes because the new guy on the crew is slow on the edger. And they are sitting in the truck for 15 minutes after they finish, scrolling their phones before they drive to the next stop.
That is an extra 70 minutes per visit. Multiply by a 3-man crew at a fully burdened rate of $25 per hour, and you are spending $87.50 more per visit than you estimated. Over a 35-week season, that single account has quietly cost you $3,062 more than you planned for.
Now ask yourself: how many of your accounts have a gap like that?
If you do not have time-on-site data — real data, not what the crew tells you — the honest answer is you have no idea.
The Pricing Problem Hiding in Every Landscaping Company
Labor is the single largest cost in a landscaping business. According to Aspire's 2025 Landscaping Industry Report, labor consumes 30 to 50 percent of total revenue. Service Autopilot's 2026 analysis puts the typical range at 25 to 40 percent, and emphasizes that the true cost is significantly higher than wages alone — labor burden (payroll taxes, workers' comp, benefits, paid time off, training) adds 20 to 35 percent on top of base wages. A $20-per-hour employee actually costs you $24 to $27 per hour before they ever pick up a trimmer.
This means that when your crew spends an extra hour at a property, you are not losing $20. You are losing $25 to $27 per crew member, plus the fuel, equipment wear, and — most importantly — the billable time at the next property that gets compressed or skipped entirely.
According to Duranta (2025), 1 in 5 landscaping jobs is unprofitable. Not thin. Not break-even. Unprofitable. And the industry's average net profit margin sits at just 6.2 percent (Wifitalents, 2023), while well-run companies target 10 to 14 percent (Fieldcamp, 2025). The most successful operations hit 14 percent (Aspire, 2025).
The difference between 6 percent and 14 percent is not better equipment or fancier trucks. It is knowing what your jobs actually cost — and that starts with knowing how long your crews are actually spending at each property.
Why Your Estimates Are Wrong (And Why Nobody Tells You)
Every landscaping owner prices jobs based on estimated labor hours. You walk a property, calculate square footage, factor in obstacles and slope, and come up with a number. Two crew-hours. Three crew-hours. Five crew-hours for the big commercial site.
The problem is that estimates are based on assumptions, and assumptions degrade over time. Here is how:
The property changed. The HOA added a flower bed. The homeowner installed a fence that forces your crew to hand-trim an area they used to mow. The trees matured and now there are twice as many leaves in the fall. You never re-timed the property. You are still billing based on the original walkthrough.
The crew changed. You bid the job assuming your A-crew would handle it. But you shifted them to a bigger account, and now your B-crew is on it — the one with the new hire who is still learning the zero-turn. The same property, the same scope of work, but 30 percent more time to complete it.
Nobody wants to tell you the truth. Your crew leader is not going to call you and say "Hey boss, that property you estimated at 2.5 hours is actually taking us 3.5." Because that conversation leads to questions about why it is taking longer, and nobody wants to be the one explaining that they stop at Wawa every morning or that the new guy slows them down. So they just do the job, fill out the timesheet, and move on. The gap between estimated and actual stays invisible — until you wonder at the end of the season why your margins are thinner than you planned.
As one landscaping industry analysis put it: a 15 percent labor overrun on a $5,000 job with thin margins can be the difference between breaking even and losing money. Scale that across 10 or 20 jobs per month, and you are thousands of dollars off target without understanding why (LeanScaper, 2025).
The Math That Changes Everything
Let us put some real numbers to the time-on-site gap for a typical landscaping operation.
Say you run 6 crews. Each crew services an average of 6 properties per day, 5 days a week, for a 35-week season. That is 6,300 property visits per season.
If the average time-on-site gap — the difference between what you estimated and what actually happens — is just 20 minutes per property, here is what that costs you:
20 minutes × 6,300 visits = 2,100 hours of unplanned labor per season.
At a fully burdened crew rate of $75 per hour (3 crew members at $25/hour), that is:
2,100 hours × $75 = $157,500 per season in labor you are paying for but did not estimate, did not bill for, and did not know about.
For a company doing $1.2 million in annual revenue at a 6 percent margin, your total net profit is $72,000. That invisible $157,500 in labor overruns is more than double your entire profit. Even if the real gap is only 10 minutes per property instead of 20, you are still looking at $78,750 — more than your entire bottom line.
This is why the industry average margin is 6 percent. It is not that landscaping owners are bad at pricing. It is that they are pricing based on estimates and never measuring the actuals. The gap between the two is where your profit disappears.
What GPS Time-on-Site Data Actually Shows You
GPS time-on-site tracking is the simplest version of job costing that exists. There is no app for the crew to open. There is no button for the crew leader to press. There is no timesheet to fill out. The GPS tracker on the truck records when the vehicle arrives at a property and when it departs. That is it.
But that simple data point — arrival time and departure time at every property, every visit, logged automatically — changes everything about how you run your business.
You see which properties are over-time. After two or three weeks of data, you will have a clear picture of which accounts are consistently running over your estimate. Not a guess. Not a feeling. A number. "The Oakwood HOA is averaging 4 hours 12 minutes. We estimated 3 hours." Now you have a decision to make — and the data to support it.
You see which properties are under-time. This is the one nobody talks about. Some properties are actually taking less time than you estimated. Your crew is in and out of the Riverside office park in 1 hour 45 minutes, but you are billing based on a 2.5-hour estimate. That is not a problem — that is a high-margin account you should be protecting and replicating.
You see which crews are faster. Same property, same scope of work, different crews. One crew does it in 2 hours 15 minutes. The other takes 3 hours 10 minutes. That is not a coincidence — that is a training opportunity, a scheduling adjustment, or a conversation about why one crew is nearly 40 percent slower on the same job.
You see the non-work time. The 15 minutes sitting in the truck before starting. The 20-minute gap between departure from one property and arrival at the next when the drive should take 8 minutes. The crew that consistently clocks their last departure at 3:45 PM but does not return to the yard until 4:30. These patterns are invisible without data. With GPS, they are obvious.
Repricing with Confidence
Here is the conversation most landscaping owners dread: telling a client their price is going up. Without data, it is a gut-feel conversation that often ends with the owner backing down because he cannot justify the increase.
With time-on-site data, the conversation changes completely.
You are not saying "I think this property takes longer than we estimated." You are saying "Our data shows that this property is averaging 4 hours 12 minutes per visit. We originally priced it at 3 hours. Here is what the adjusted pricing looks like." You have the receipts. The client can accept the new price or find someone else to lose money on their property — either way, you win.
And here is the part that surprises most owners: when you reprice your 5 worst-performing accounts, the impact is immediate and dramatic. If each of those 5 accounts was costing you $50 per visit more than you were billing — a common gap — and you fix it, that is $250 per week, $8,750 per season, recovered from just 5 accounts. Do it across your entire book of business and the effect compounds into tens of thousands of dollars.
This is how companies move from 6 percent margins to 14 percent margins. Not by working harder. Not by adding crews. By knowing what every property actually costs and pricing accordingly.
The Accountability Angle
Time-on-site data does more than fix your pricing. It also creates a culture of accountability that your best employees will welcome.
According to a survey by TSheets (Intuit QuickBooks) and HR C-Suite, 95 percent of employees rate GPS tracking as positive or neutral. 75 percent say it helps track mileage and time more accurately. And 50 percent say it actually builds trust with their employer.
Your best crew leaders already know they are doing good work. They want the data to prove it. They are tired of busting their tails while the crew down the road coasts through half the day and nobody says anything. GPS time-on-site data does not create tension — it resolves it, because now performance is measured, not assumed.
The American Payroll Association and Workpuls estimate that businesses lose 5 to 10 percent of payroll to time theft annually. For a landscaping company with $500,000 in annual labor costs, that is $25,000 to $50,000 per year. GPS-verified arrival and departure times close that gap without a single confrontation — because the crew knows the data exists, and the behavior self-corrects.
In an industry with 42 percent annual employee turnover (Wifitalents, 2023) and 76 percent of companies carrying at least one open position (2024 State of the Landscape Labor Market), you cannot afford to lose good people because your management systems are based on suspicion instead of facts. Time-on-site data gives you facts.
Why Alertrax Is the Simplest Way to Get Time-on-Site Data
There are plenty of ways to track crew time. Apps. Timesheets. Check-in systems. The problem with all of them is the same: they require your crew to do something. Open an app. Press a button. Fill out a form. And the moment the process depends on human compliance, the data gets unreliable.
Alertrax eliminates that problem entirely. It is a GPS tracker that mounts to the truck. It records arrival and departure at every property automatically. There is nothing for the crew to do, nothing to forget, nothing to game. The data is objective, continuous, and requires zero training.
- Automatic Time-on-Site Logging: Every arrival and every departure at every property is recorded with a timestamp. No app. No button. No crew input required. You open the Fleet Portal and see exactly how long each truck spent at each location.
- One-Year Battery Life, No Wiring Required: Alertrax runs on a self-contained battery that lasts a full year. Mount it on a truck and it works. Mount it on a trailer and it works. No wiring, no OBD-II ports, no installation appointments.
- Track More Than Just Trucks: Put Alertrax on your landscape trailers, your dump trailer, your skid steer, your mower trailer — any asset that moves between properties. See where everything is, not just where the trucks are.
- 100% Waterproof, Ruggedized Housing: Built for the conditions landscaping equipment actually operates in — rain, mud, dust, pressure washing, extreme heat. It does not quit because it got wet.
- Covert Magnetic Mounting: Mounts to any steel surface. Tuck it under a bumper, inside a frame rail, behind a panel. No visible hardware. The crew does not need to interact with it, and nobody else needs to know it is there.
- Real-Time Fleet Portal and Mobile App: See every truck and piece of equipment on a single live map. Check time on site from your phone while you are at a client meeting, at the supply house, or at home after hours.
- Complete Route History: A full breadcrumb trail showing everywhere each vehicle has been, with timestamps. Use it for job costing, client billing verification, route optimization, and crew accountability.
- Geofence and After-Hours Alerts: Set virtual boundaries around your yard, your storage lot, or any job site. If equipment moves after hours, you know instantly.
Pricing That Pays for Itself Before the First Month Is Over
You can put Alertrax on every truck and trailer in your fleet for a low monthly rate — no long-term contracts, no hidden fees.
(Want to own it outright? We offer a $599 Lifetime option for permanent, subscription-free tracking.)
Think about the math we just walked through. If time-on-site data helps you identify and reprice just 5 underperforming accounts — recovering $50 per visit each — that is $8,750 per season from 5 accounts alone. If it helps you identify and address 20 minutes of daily time waste across 6 crews, that is $78,750 per season in recovered labor productivity.
The 2025 Fleet Technology Trends Report (Bobit Business Media) found that 47 percent of fleets see a full return on their GPS investment in under 12 months. For landscaping companies, the ROI timeline is measured in weeks — because the data starts flowing the day you mount the tracker, and the first insight that saves you money usually comes within the first week.
And Yes — It Prevents Theft Too
This entire article has been about job costing, pricing accuracy, and crew accountability — the operational data that determines whether your business makes 6 percent or 14 percent. But there is another benefit worth mentioning.
Landscaping companies park expensive assets in unsecured locations every single day. Trucks in driveways. Trailers on the street. Mowers on open trailers at job sites. Equipment theft costs the landscaping and construction industries hundreds of millions of dollars per year, and the recovery rate for stolen equipment is below 21 percent (NER / NICB).
With Alertrax, if any tracked asset moves outside its geofence after hours, you know immediately. You can track it in real time and direct law enforcement to its exact location.
Job costing intelligence by day. Theft protection by night. One device. One investment. And more profit at the end of every season.
Stop Guessing. Start Measuring.
You would never buy materials without knowing the price. You would never sign a contract without knowing the scope. But right now, you are paying your crews to service properties without knowing how long the work actually takes.
That gap between estimated and actual is where your profit lives — or where it dies. The only way to close it is to measure it. And the simplest way to measure it is a GPS tracker that records arrival and departure at every property, every visit, without asking your crew to lift a finger.
Visit www.buyalertrax.com today and find out what your properties actually cost.
Sources
Aspire (2025) — Labor = 30–50% of total revenue; most successful companies at 14% profit margin
Service Autopilot (2026) — Labor runs 25–40% of revenue; labor burden adds 20–35% on top; $20/hr employee costs $24–$27/hr
Duranta (2025) — 1 in 5 landscaping jobs is unprofitable
Wifitalents (2023) — Industry average profit margin: 6.2%; 42% annual employee turnover
Fieldcamp (2025) — Well-run landscaping companies target 10–14% net profit
NALP / IBISWorld — $188.8B U.S. landscaping market; ~700,000 businesses; 1.4M employed
2024 State of the Landscape Labor Market — 76% of companies have at least one open position
LeanScaper (2025) — 15% labor overrun impact on job profitability analysis
TSheets (Intuit QuickBooks) / HR C-Suite — 95% of employees rate GPS tracking positive or neutral; 75% say it tracks time accurately; 50% say it builds trust
Workpuls / American Payroll Association — Businesses lose 5–10% of payroll to time theft annually
2025 Fleet Technology Trends Report (Bobit Business Media) — 47% of fleets achieve positive ROI in under 12 months
NER / NICB — Equipment theft recovery rate below 21%