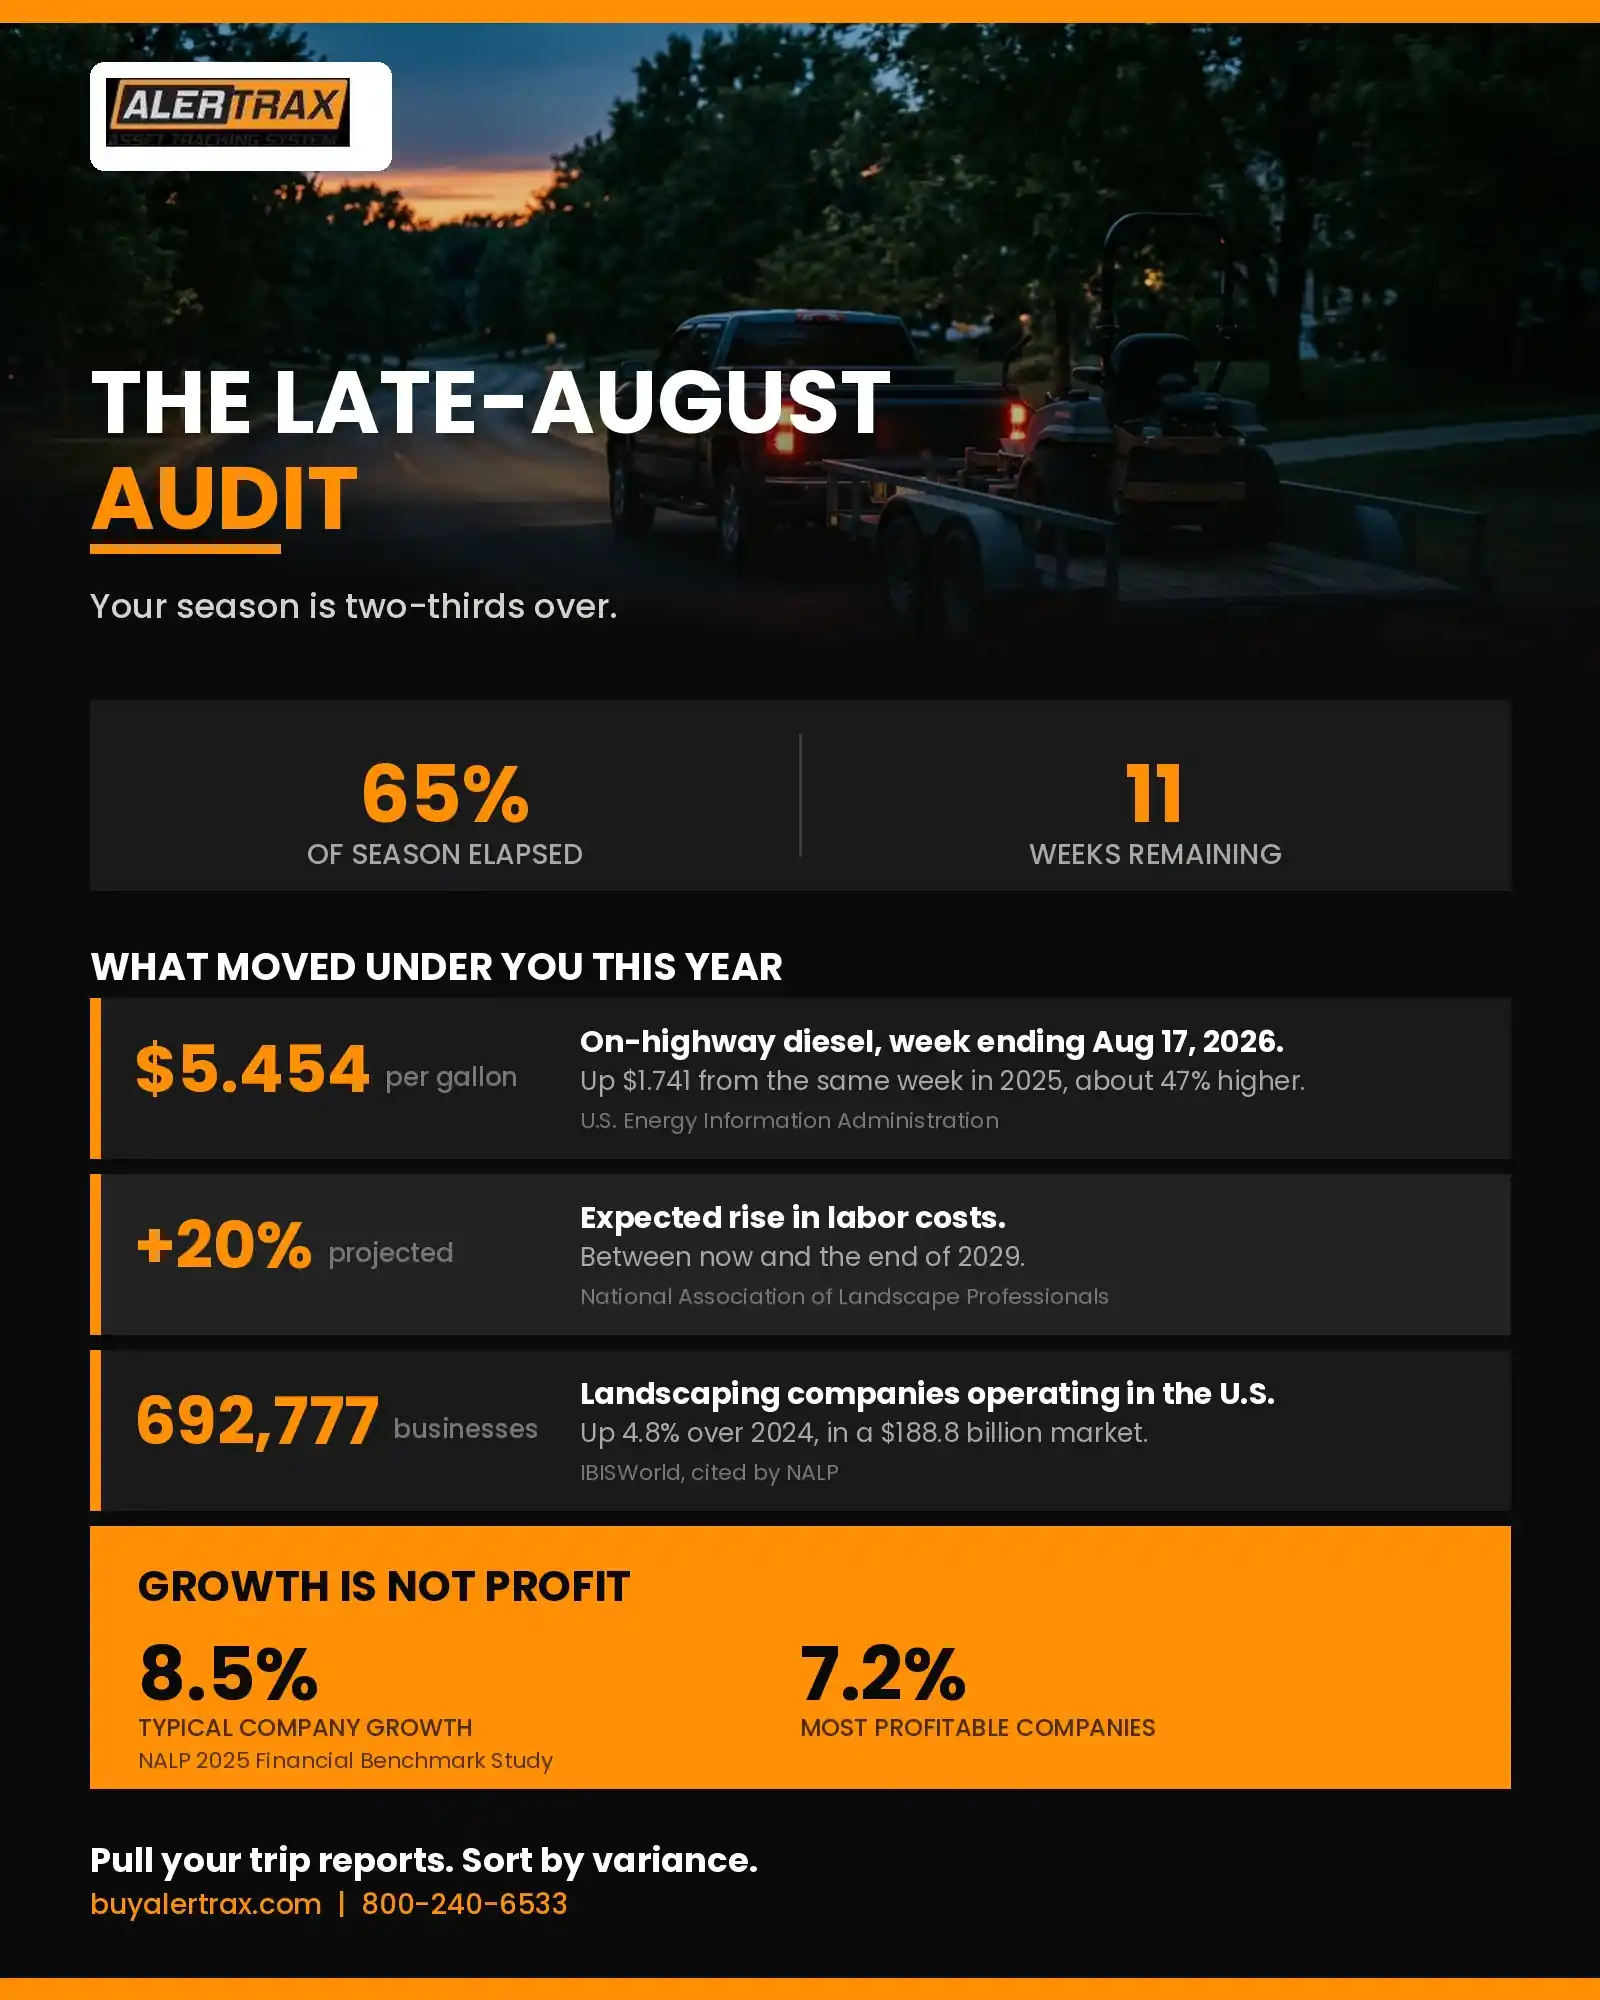
It is the last week of August. Depending on where you run, your season started somewhere around the first of April and it will wind down somewhere around the middle of November. Do the arithmetic and you are roughly two-thirds of the way through the year, with about eleven weeks left on the board.
That number is the entire point of this article.
Eleven weeks is not enough time to rebuild your company. It is more than enough time to stop a specific account from bleeding hours, to tighten a route before leaf season doubles your stop count, to reprice a contract before you renew it for another year, and to walk into next spring's bidding with numbers that came from reality instead of from what you assumed back in February.
Most owners do none of this. They run flat out until the last cleanup, close the books in December, look at the year in January, and discover that three properties ate their margin. By then the season is over, the crews are laid off or gone, the memory of which jobs ran long has faded, and there is nothing to do but hope next year is different.
Late August is the last point on the calendar where you have enough season behind you to see the pattern and enough season ahead to do something about it. This is the audit.
Three Things That Moved Under You This Year
Before you look at your own numbers, it helps to know what changed in the environment you priced against. Two of these are large enough that they alone can explain a margin gap.
Fuel is up sharply. The U.S. Energy Information Administration put the national average on-highway diesel price at $5.454 per gallon for the week ending August 17, 2026. That is up 19.7 cents in a single week, and it is $1.741 per gallon above the same week in 2025, an increase of roughly 47 percent year over year (U.S. Energy Information Administration, Weekly Retail On-Highway Diesel Prices).
Sit with that for a second. If you bid your 2026 maintenance contracts in the winter using last year's fuel experience, every mile your trucks have driven since then has cost you about half again what you planned for. Nobody sent you a notice. It just quietly happened, one fill-up at a time.
Labor is not done climbing. The National Association of Landscape Professionals reports that labor costs are expected to rise roughly 20 percent between now and the end of 2029, and that the top two concerns for landscape companies are finding qualified employees and maintaining profit levels (NALP, Landscape Industry Statistics).
On the supervisory side, the most recent federal wage data puts first-line supervisors of landscaping, lawn service, and groundskeeping workers at a mean hourly wage of $29.31 and a mean annual wage of $60,960, across 130,760 workers nationally (U.S. Bureau of Labor Statistics, Occupational Employment and Wage Statistics, May 2025, released May 15, 2026). Your foreman's hour is an expensive unit. Every hour of his that goes unaccounted for is expensive in the same proportion.
The market got more crowded. The landscape services industry reached a market size of $188.8 billion in 2025, employing more than 1.4 million people across 692,777 businesses, a 4.8 percent increase over 2024, with average growth of 6.5 percent per year between 2020 and 2025 (IBISWorld Landscaping Services Industry Report, cited by NALP). Meanwhile the January 2026 economic forecast produced for NALP by ITR Economics characterizes 2026 as a year of mild to moderate growth with significant deviation between individual markets, and notes a soft spot in construction covering both single-unit housing and nonresidential work.
Translated: more competitors, uneven demand, and rising input costs. This is not a year where you can afford to find out in January which accounts were underwater.
The Number That Should Change How You Think About Growth
Here is the single most useful statistic in this article, and almost nobody in the industry talks about it.
In NALP's 2025 Financial Benchmark Study, participating companies had a median of 355 customers and generated $14,682 per customer. The typical company reported sales growth of 8.5 percent. And the most profitable companies? They grew by 7.2 percent (NALP, 2025 Financial Benchmark Study).
Read that again. The most profitable companies in the study grew more slowly than the typical company.
That is not a fluke of the sample. It is what happens when a business chases revenue without knowing which revenue is worth having. Taking on eleven new accounts feels like winning. If four of them are priced below what they actually cost to service, you have just bought yourself more work, more windshield time, more payroll, and less money. The companies at the top of the profit table are not the ones saying yes to everything. They are the ones who know, per property, what the work consumes.
You cannot know that from an invoice. An invoice records what you charged. It says nothing about what the job took.
Four Questions Your Season Already Answered
The good news is that if you have been tracking your trucks and equipment this year, the audit does not require you to gather anything. Five months of data are already sitting in your fleet portal. You just have to ask it the right four questions.
1. Which properties consumed more hours than you bid?
Pull time-on-site data for every recurring account from April forward. Compare actual minutes on the property against the minutes you assumed when you priced it. You are not looking for small variances. You are looking for the accounts that are consistently 20, 30, 40 percent over, week after week. Those are not bad days. That is a mispriced contract, and it has been mispriced every single visit since spring.
2. Where is your drive time actually concentrated?
Trip reports give you distance and duration between stops. Sort a week of routes by drive time rather than by stop count. Most companies find one or two accounts that sit geographically outside every cluster they serve, generating forty-five minutes of unbillable windshield time each way. At current diesel prices that account may be costing you money even if the service itself is priced correctly.
3. Which crews finish faster, and is it quality or corner-cutting?
When two crews service comparable properties and one is consistently 25 percent faster, that is worth understanding rather than assuming. Sometimes it is a better foreman and a route worth copying. Sometimes it is work being skipped that a customer will complain about in October. The time-on-site data tells you where to look. Your eyes tell you which it is.
4. What did you bill without ever verifying?
Every service business has accounts where the invoice goes out on schedule and nobody has confirmed in months that the visit happened as described. Arrival and departure timestamps close that loop retroactively. Most of the time the data confirms everything is fine, which is worth knowing in itself. Occasionally it does not, and you would rather find that yourself than have a customer find it.
A Worked Example, With Placeholder Numbers
To make this concrete, here is the arithmetic on a single finding. Treat every input below as an illustrative placeholder, not as research data. Substitute your own figures.
Say you service 60 recurring maintenance accounts. Say the audit shows that 1 in 8 of them is running about 45 minutes over the time you priced, every visit. Say your fully burdened labor cost is $28 per hour, and you have 11 weekly visits left in the season.
- 60 accounts, 1 in 8 over = 7.5 accounts
- 7.5 accounts x 0.75 hours x 11 remaining visits x $28 = about $1,730 still to be lost this season
- Across a full 32-visit year, the same gap is roughly $5,000
Now the fuel side, same treatment. Four trucks burning 60 gallons a week apiece, at the $1.741 per gallon year-over-year increase EIA reported for mid-August:
- 4 trucks x 60 gallons x $1.741 = about $418 per week more than last year
- Over the remaining 11 weeks, roughly $4,600
Neither number is going to close your business. That is exactly why they are dangerous. They are small enough to be invisible on a monthly P&L and large enough to be most of the difference between a good year and an average one. And they compound, because the mispriced account gets renewed at the same price next year unless somebody catches it.
Eleven weeks is enough time to catch it.
The Eleven-Week Action List
Findings are worthless without a sequence. Here is a realistic one that fits inside the season you have left.
Weeks 1 and 2: Pull and sort. Export trip reports and time-on-site data for the season to date. Build one simple sheet: property, priced hours, actual average hours, variance. Do not analyze yet. Just get it on paper.
Weeks 3 and 4: Separate the three kinds of problems. Mispriced work, inefficient routing, and crew execution look identical in a spreadsheet and require completely different fixes. Repricing a route problem does not solve it. Retraining a crew on a job that was underbid from day one is unfair to the crew.
Weeks 5 through 7: Fix routing before leaf season. This is the deadline that matters most. Fall cleanup adds stops, adds load-out time, and adds hauling. A route that is merely inefficient in August becomes genuinely expensive in October. Regroup geographically now, while you still have weeks of ordinary service to test the change against.
Weeks 8 and 9: Have the repricing conversations. Renewals for next season get discussed in the fall. Going into that conversation with property-specific data changes it completely. "Our costs went up" is a weak argument. "Your property has averaged 3 hours and 40 minutes per visit against the 2 hours and 45 minutes we priced, and here are the timestamps" is a factual conversation about a contract that no longer matches the work.
Weeks 10 and 11: Set next year's bidding baseline. Take your actual hours per property type and use them as the estimating standard for spring. This is the compounding step. Every bid you write next winter inherits either your real numbers or your assumptions, and you only get to choose once.
The Data This Audit Requires
Everything above depends on one thing: having a record of when your trucks and equipment arrived at each property and when they left. If you have that, the audit is a weekend of spreadsheet work. If you do not, you are reconstructing five months from memory, which is not an audit.
AlerTrax generates that record automatically, without anyone on your crew having to log anything.
- Time-on-site logging: Arrival and departure timestamps recorded at every stop, with no check-in required from the crew.
- AddressFence: Upload your customer address list once and get arrival and departure notifications for every property automatically, which is what turns a season of driving into a season of records.
- Trip reports: Start time, stop time, addresses, distance, and duration for every trip, exportable by date range, by vehicle, or across the whole fleet. This is the file your audit spreadsheet comes from.
- Live GPS tracking: Location updates as often as every 2 minutes on the fleet map and in the app.
- Over a year of battery life on two AA batteries: No wiring, no OBD-II port, no installation appointment. Mount it and it reports.
- Track anything that moves: Trucks, trailers, mowers, skid steers, and equipment, so utilization data covers the whole operation and not just the vehicles.
- 100 percent waterproof, ruggedized housing: IP67 rated, built for mud, rain, and pressure washing.
- Geofence and after-hours movement alerts: Notification when an asset moves outside the hours it should be moving.
The AlerTrax Fleet Portal is where the exports live. If you put devices out today, you will not have this April's data, but you will have September, October, and November, which is the entire fall cleanup season and the exact window where routing gets expensive.
What It Costs
AlerTrax is $49.95 per month for 12 months per device, with no long-term contract and no hidden fees. (A $599 Lifetime option is available if you would rather own the device outright with no subscription.)
Put that next to the worked example above. A single mispriced account caught in September, on placeholder numbers, was worth roughly $5,000 a year. You do not need the audit to find eight problems. You need it to find one.
Order at checkout.alertrax.com, or call 800-240-6533 and we will talk through how many devices your operation actually needs before you buy anything.
A Note on the Off-Season
One more thing worth mentioning while you have eleven weeks of attention. When the season closes, your equipment consolidates into a yard and sits there through the winter, largely unwatched. The same devices running your audit keep reporting through the off-season, and after-hours movement alerts do not care what month it is. It is not the reason to do this, but it is a real benefit of having already done it.
Eleven Weeks
The difference between owners who improve year over year and owners who repeat the same season indefinitely is not effort. Everybody in this industry works hard. The difference is whether the next year gets built on measured numbers or on remembered ones.
You have about eleven weeks of season left and five months of data already sitting in a portal. Pull the report this week. Sort it by variance. Look at the worst three properties.
That is the whole audit, and it is the cheapest thing you will do all year.
Start the season with a real record next spring. Visit checkout.alertrax.com, or email sales@buyalertrax.com with questions. You can also reach us at 800-240-6533.
Sources
U.S. Energy Information Administration - Weekly Retail On-Highway Diesel Prices; national average $5.454 per gallon for week ending August 17, 2026, up $1.741 from the comparable week in 2025
U.S. Bureau of Labor Statistics - Occupational Employment and Wage Statistics, May 2025 (released May 15, 2026); first-line supervisors of landscaping, lawn service, and groundskeeping workers: 130,760 employed, $29.31 mean hourly, $60,960 mean annual
National Association of Landscape Professionals - Landscape Industry Statistics; labor costs projected to rise roughly 20 percent through the end of 2029; top concerns are qualified employees and profit levels
NALP, 2025 Financial Benchmark Study - Median 355 customers, $14,682 per customer, typical sales growth 8.5 percent, most profitable companies grew 7.2 percent
IBISWorld Landscaping Services Industry Report, cited by NALP - $188.8 billion market size in 2025; 692,777 businesses, up 4.8 percent from 2024; more than 1.4 million employed; 6.5 percent average annual growth 2020 to 2025
ITR Economics, January 2026 Economic Forecast Report for NALP - 2026 characterized as mild to moderate growth with significant deviation between markets and a soft spot in construction
Illustrative arithmetic: The 60-account example, the 1-in-8 over-servicing rate, the $28 fully burdened labor rate, the 45-minute variance, and the 60-gallon-per-truck weekly fuel figure are placeholder inputs chosen to demonstrate the calculation method. They are not survey findings and should be replaced with your own numbers.