Ask a landscaping owner where the risk is in his business and he will point at the equipment. The mower deck. The chipper. The stump grinder. The skid steer on a slope. Those are the things that look dangerous, and they are the things that get talked about at the tailgate meeting.
The federal data points somewhere else entirely. It points at the drive.
Not the job site. The twenty minutes between the yard and the first property, and the twenty minutes between that property and the next one, done six or eight times a day, five or six days a week, by a crew in a loaded truck pulling a trailer through residential streets.
That is where the numbers say the worst outcomes actually happen, across every industry that sends people out in vehicles. And there is a figure in the most recent release that landscaping owners specifically should sit with, because while the national picture improved, this industry's did not.
What the Federal Numbers Actually Show
The Bureau of Labor Statistics publishes the Census of Fatal Occupational Injuries, which is the authoritative federal count of work-related deaths in the United States. The 2024 data was released on February 19, 2026.
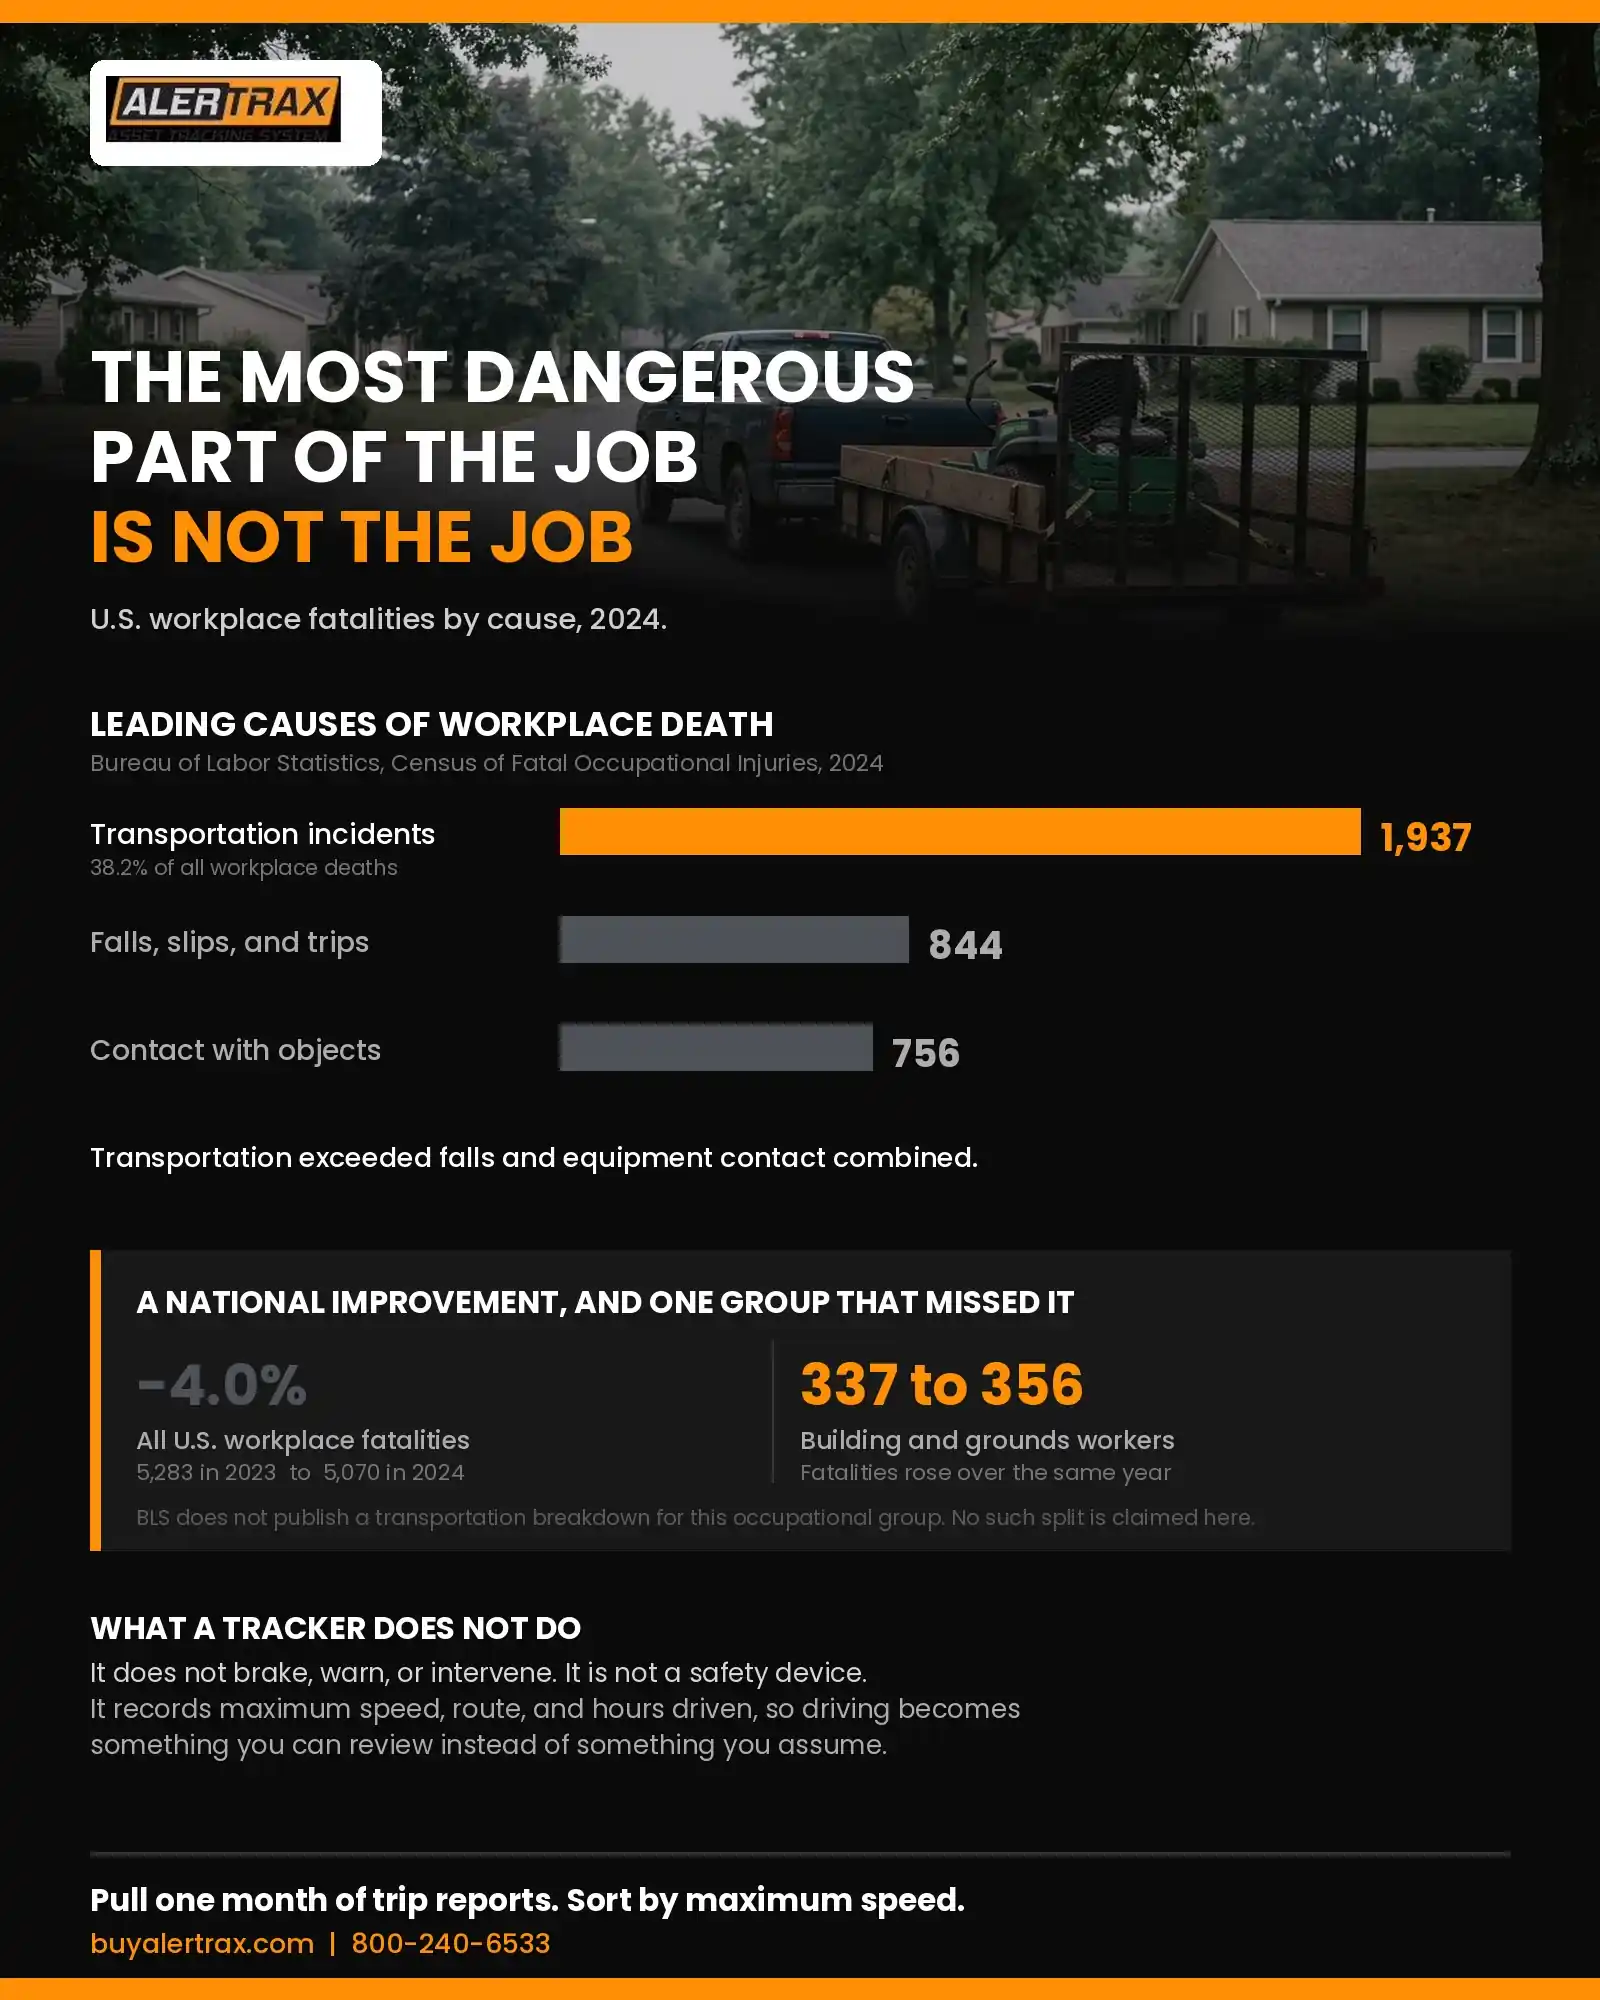
The headline was genuinely good news. There were 5,070 fatal work injuries in 2024, down 4.0 percent from 5,283 in 2023, and the fatal injury rate fell to 3.3 per 100,000 full-time equivalent workers from 3.5 the year before (U.S. Bureau of Labor Statistics, Census of Fatal Occupational Injuries, 2024).
Underneath that improvement, the distribution of how people die at work barely moved, and it has not moved much in years.
Transportation incidents were the leading cause of workplace death for 2024, accounting for 1,937 fatalities, or 38.2 percent of the total (BLS, CFOI 2024). Nothing else is close. Falls, slips, and trips came second at 844. Contact with objects and equipment, the category most people picture when they think about landscaping risk, accounted for 756.
Read those three numbers next to each other. Transportation killed more workers than falls and equipment contact combined.
Within the transportation category, roadway incidents involving motorized land vehicles accounted for 1,146 deaths, down 8.5 percent from 1,252 in 2023. But pedestrian incidents involving motorized land vehicles went the other direction, rising 19.0 percent to 369 from 310 (BLS, CFOI 2024).
The Number Landscaping Owners Should Not Skip Past
Here is the figure that made this article worth writing.
In a year when total workplace fatalities dropped 4 percent nationally, work fatalities among building and grounds cleaning and maintenance workers increased to 356 in 2024, up from 337 in 2023 (BLS, CFOI 2024).
That is the occupational group your crews sit in. The country got safer. This line of work did not.
We are not going to dress that number up or pretend it says more than it says. BLS does not break out how many of those 356 were transportation-related, so nobody should claim a precise split. What the data supports is narrower and still worth acting on: transportation is the leading killer across all work, and this occupational group moved the wrong way in a year when most did not.
If you run crews, that is enough to justify looking at how your trucks get driven.
Why Late August Is the Wrong Time to Coast
Two things change about driving conditions right now, and both of them cut against you.
School is back. Residential streets that were quiet all summer at 7:15 in the morning and 2:45 in the afternoon are now full of buses, parents queuing at drop-off, and kids on foot. Your crews are running those same streets at those same hours, in the largest vehicles on the road. Recall that pedestrian incidents involving motorized land vehicles were the one transportation subcategory that rose in 2024, by 19 percent.
Daylight is going. From here to the end of the season you lose roughly two to three minutes of evening light every day. By mid-October the last hour of a normal workday is happening in dusk or dark, with a tired crew, a loaded trailer, and a truck that has been running since six in the morning. Fall cleanup then adds hauling weight and dump runs to that same window.
None of that is a reason for alarm. It is a reason to pay attention to a part of the operation most owners never look at directly, during the eleven or twelve weeks when the conditions are worst.
Four Things You Actually Control
You cannot control other drivers, weather, or road design. Here is what is genuinely inside your reach.
1. Speed, specifically on the return leg. Crews do not usually speed on the way out. They speed on the way back, at the end of a long day, when the trailer is loaded and everyone wants to be done. If you have never looked at maximum speed by trip, you have never looked at the single most modifiable behavior in the whole operation.
2. Route design, which is a safety question and not only a cost question. Every unnecessary mile is exposure. A route that zigzags across town does not just burn fuel and billable hours, it puts your crew in traffic more times than the work requires. Tightening a route reduces risk in exactly the same proportion that it reduces cost, which is a rare case of two goals pointing the same direction.
3. The length of the driving day. A crew that starts at 6:00 AM and is still towing at 6:30 PM is doing its most demanding driving at its least alert hour. That is a scheduling decision, not a personnel problem, and it is yours to make.
4. After-hours use of company vehicles. A truck and trailer being driven on a Saturday night for reasons unrelated to the business is a liability exposure sitting on your insurance policy. Most owners have no idea whether it happens.
What Tracking Data Does, and What It Does Not
This is the part where a GPS company usually oversells, so let us be direct about the limits first.
A tracking device is not a safety device. It will not prevent a collision, brake for anybody, warn a driver, or make a tired crew alert. It has no role whatsoever in the moment something goes wrong. Any vendor telling you their tracker prevents accidents is selling you something the product does not do.
What it does is narrower and still useful: it turns driving behavior from something you assume into something you can look at.
Every AlerTrax trip report records start time, stop time, addresses, distance, duration, and maximum speed. That last field is the one most owners have never examined. Pull a month of it and you will learn, for the first time, whether the thing you assume about how your trucks are driven is actually true.
Usually it mostly is. Occasionally it is not, and the pattern is specific: one vehicle, one time of day, one stretch of road. That is a conversation you can have with one person about one habit, which is a manageable problem. Not knowing is what makes it unmanageable.
Route history does the same for exposure. Once you can see the actual sequence your crews drive, the unnecessary miles become visible, and cutting them reduces cost and time on the road together.
After-hours movement alerts answer the fourth question directly. If a truck moves at 11:00 PM on a Saturday, you know. Not so you can police your people, but because a company vehicle in unauthorized use is your exposure regardless of who is driving it.
Having the Conversation Without Making It Worse
Speed data is the most easily mishandled information in this entire category. Used badly, it turns into a gotcha culture that makes good employees quit. A few things that keep it useful.
Tell the crew the data exists before you ever use it. Introducing tracking quietly and then confronting somebody with a speed report is the fastest way to lose the room. Say up front that trip reports include speed and that you look at them.
Look for patterns, not incidents. One high reading on one trip is noise. It could be a downhill grade, a merge, or a GPS artifact. A driver who is consistently ten over on the same road every Thursday is a pattern, and only patterns are worth a conversation.
Ask before you accuse. A crew running late every Thursday afternoon may be telling you the Thursday route is overloaded. The speeding might be a symptom of a scheduling problem you created. That is worth finding out before anybody gets written up.
Frame it as protection. Documented driving history protects careful drivers. When a customer or another motorist claims your truck did something it did not do, the trip record is the thing that answers it.
This article is general business information, not legal, safety, or insurance advice. Vehicle safety programs, employee monitoring, and driver policies are governed by rules that vary by state and by situation. Consult qualified professionals about your specific circumstances.
What AlerTrax Records
AlerTrax is built for the way landscaping and hardscaping fleets actually operate, with no wiring and no install appointments.
- Trip reports with maximum speed: Start time, stop time, addresses, distance, duration, and max speed for every trip, exportable by date range or by vehicle.
- Route history: The complete stop sequence for any day, so unnecessary miles and unnecessary exposure become visible together.
- Live GPS tracking: Location updates as often as every 2 minutes on the fleet map and in the app.
- After-hours movement alerts: Instant notification when a vehicle or trailer moves outside the hours it should be moving.
- Over a year of battery life on two AA batteries: No splicing, no OBD-II port, no downtime to install.
- Track anything that moves: Trucks, trailers, mowers, and skid steers, so the trailer is covered as well as the truck pulling it.
- 100 percent waterproof, ruggedized housing: IP67 rated, built for mud, rain, and pressure washing.
TeamTrax, the free companion app, adds overspeed notifications with a speed limit you set, on scheduled work hours only. Everything exports from the AlerTrax Fleet Portal.
What It Costs
AlerTrax is $49.95 per month for 12 months per device, with no long-term contract and no hidden fees. (A $599 Lifetime option is available if you would rather own the device outright with no subscription.)
We are not going to put a dollar figure on avoided collisions, because nobody can honestly calculate that and the attempt would be insulting. The measurable returns are the ordinary ones covered in our other articles: tighter routes, verified job times, accurate billing. The driving visibility comes along with them.
Order at checkout.alertrax.com, or call 800-240-6533.
Look at One Month of Speed Data
The point of this article is not to alarm anybody. Most crews drive fine, most days end uneventfully, and the national numbers moved in the right direction last year.
But transportation remains the leading cause of workplace death by a wide margin, this occupational group moved the wrong way in 2024, school is back on your crews' morning routes, and you are heading into the darkest and heaviest ten weeks of the season.
Pull one month of trip reports and sort by maximum speed. It takes about fifteen minutes. Most owners find nothing much, which is worth knowing. Some find one truck, one driver, one stretch of road, and get to fix it while it is still a habit rather than an incident.
Visit checkout.alertrax.com, email sales@buyalertrax.com, or call 800-240-6533.
Sources
U.S. Bureau of Labor Statistics, Census of Fatal Occupational Injuries, 2024 (released February 19, 2026) - 5,070 fatal work injuries, down 4.0 percent from 5,283 in 2023; fatal injury rate 3.3 per 100,000 full-time equivalent workers
BLS, CFOI 2024 - Transportation incidents the most frequent fatal event, 1,937 fatalities, 38.2 percent of all occupational fatalities; falls, slips, and trips 844; contact with objects and equipment 756
BLS, CFOI 2024 - Roadway incidents involving motorized land vehicles 1,146, down 8.5 percent from 1,252; pedestrian incidents involving motorized land vehicles 369, up 19.0 percent from 310
BLS, CFOI 2024 - Work fatalities among building and grounds cleaning and maintenance workers increased to 356 in 2024 from 337 in 2023
Note on interpretation: BLS does not publish a transportation-specific breakdown within the building and grounds cleaning and maintenance occupational group. This article does not claim one. The national transportation share and the group-level year-over-year increase are reported separately because that is how the source reports them.
Note on daylight: The reference to losing roughly two to three minutes of evening light per day is a general seasonal approximation for mid-latitude U.S. locations and varies by latitude and date.