Ask any owner in the trades to name the most dangerous thing their crews do all day and you will hear about the chipper, the skid steer, the ladder, the trencher, the roof. Reasonable answers. All of them wrong.
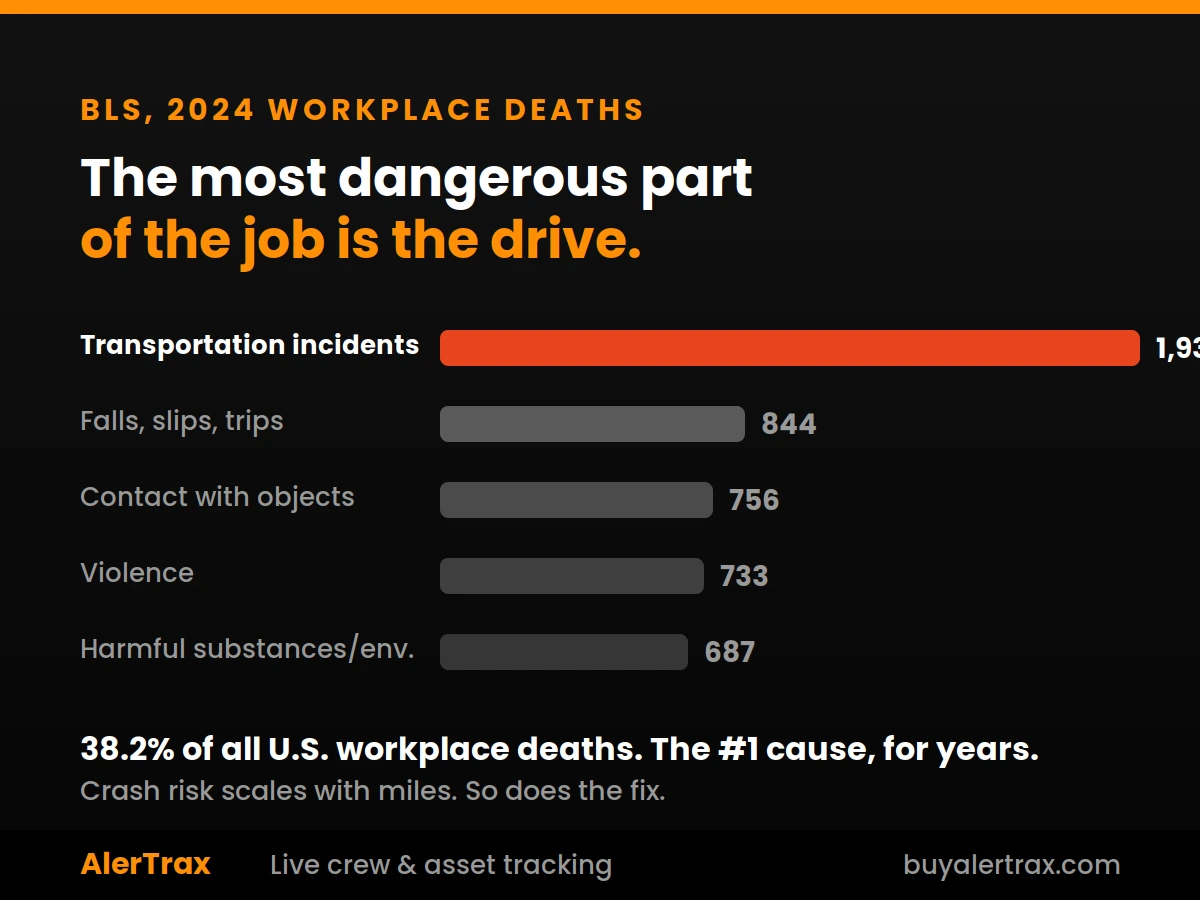
The most dangerous part of the job is the part nobody thinks of as the job: the drive between sites. According to the Bureau of Labor Statistics, transportation incidents killed 1,937 American workers in 2024, which is 38.2 percent of every workplace death in the country and the single largest category by a wide margin (U.S. Bureau of Labor Statistics, Census of Fatal Occupational Injuries). More workers die in vehicles than from falls, machinery, and violence individually. It has been the leading cause for years, and it stays that way because the exposure is constant and completely routine.
Here are the numbers on what happens between job sites, and what it costs when it goes wrong.
The Fatality Picture
- 5,070 workers died from on-the-job injuries in the U.S. in 2024, one every 104 minutes (BLS, Census of Fatal Occupational Injuries, released February 2026).
- 1,937 of those deaths, 38.2 percent, were transportation incidents, the most frequent fatal event category for years running (BLS, CFOI 2024).
- 1,146 were roadway incidents involving motorized land vehicles, in other words ordinary crashes on ordinary roads (BLS, CFOI 2024).
- 356 building and grounds cleaning and maintenance workers died on the job in 2024, up from 337 the year before, one of the few occupational groups where fatalities rose while the national total fell 4 percent (BLS, CFOI 2024).
That last number is worth pausing on if you run landscaping crews. National workplace deaths went down last year. Yours went up.
The Cost Picture
Fatalities are the extreme end. The financial exposure sits mostly in the crashes everyone survives, and it lands on the employer:
- $72.2 billion. What motor vehicle crashes cost U.S. employers in a benchmark year, counting medical care, liability, lost productivity, and property damage (Network of Employers for Traffic Safety, in cooperative agreement with NHTSA).
- Up from $47.4 billion six years earlier, a 52 percent increase in employer crash costs over that span (NETS).
- Special trades construction ranks among the highest-cost industries per employee, alongside trucking and local transportation (NETS). Field service work concentrates the exposure: your people are on the road all day, in loaded trucks, often towing.
- $47,316. The average workers' compensation claim cost (National Safety Council, Injury Facts). One injured crew member is a five-figure event before a single lawyer is involved.
- $181.4 billion. The total cost of work injuries in the U.S. in 2024 across all causes (National Safety Council).
And these are the direct costs. They do not include the truck out of service during your busiest weeks, the crew that cannot work without it, the customers rescheduled, the insurance renewal that arrives 20 percent higher, or the deposition three years later.
Why Service Fleets Carry More Risk Than They Think
A long-haul trucking company knows it is a driving business. A landscaping or HVAC company thinks of itself as a service business that happens to drive, which is exactly why the exposure goes unmanaged. Consider what a normal day looks like:
- Loaded vehicles. A truck towing a trailer with two mowers stops very differently than the pickup your foreman drives on the weekend, and nobody re-learns that in July.
- Constant stops. Six to twelve stops a day means dozens of pull-outs, backing maneuvers, and parking situations on residential streets with kids, dogs, and blind driveways.
- Schedule pressure. A crew running forty minutes behind on a packed peak-season day has a reason to drive faster than they should, and the reason came from the office.
- Fatigue. The drive home at 6 PM after nine hours of physical labor in ninety-degree heat is not the same drive as the one at 7 AM.
Notice how many of those trace back to decisions made by whoever builds the schedule. That is the uncomfortable and useful part: a meaningful share of crash exposure is not about who is behind the wheel. It is about how many miles you asked them to cover and how tightly you stacked the day.
Being Straight About What a Tracker Does Here
Time for the honest part, because this is where a vendor would promise you a safety miracle. AlerTrax is not a collision avoidance system. It does not watch the road, warn a driver, detect a phone in someone's hand, or intervene in the two seconds before an impact. It cannot make anyone a better driver on its own, and no tracker prevents a crash.
What fleet data does contribute is narrower and still worth having:
- Fewer unnecessary miles means less exposure. This is the honest headline. Crash risk scales with miles driven. The wasted miles we priced at $70 to $85 an hour of crew time carry a safety cost too, and every zigzag route you eliminate removes real exposure. Route optimization is a safety program that happens to pay for itself.
- Trip reports show max speed after the fact. Every AlerTrax trip logs start time, stop time, distance, duration, and maximum speed. That is not live coaching, but it is a monthly conversation you can have with evidence rather than suspicion, and it tells you whether a particular route or schedule is producing speeding.
- Schedules can be tested against reality. If the route data says a day requires more driving than the hours allow, the schedule is asking someone to speed. That is fixable in the office.
- Location records are liability defense. When a claim arrives alleging your truck was somewhere at some time, timestamped location history either supports it or refutes it. Documentation is not prevention, but in a disputed claim it is the difference between arguing and knowing.
Why AlerTrax Fits a Service Fleet
AlerTrax was built for trucks that work, not for enterprise logistics:
- Over a Year of Battery Life, No Wiring: No splicing, no OBD port, no install appointment. Magnetic mount, a minute per vehicle, across trucks, trailers, mowers, and skid steers.
- Trip Reports: Start and stop times, addresses, distance, duration, and maximum speed for every trip, exportable from the fleet portal.
- Route History: Every day's actual route on a map, so unnecessary miles and unrealistic schedules become visible.
- Automatic Time-on-Site Logging: Arrival and departure timestamps at every stop, for job costing, billing, and documented location history.
- Live Fleet Map: Every asset in the AlerTrax Fleet Portal and the iOS and Android app, updated as often as every 2 minutes.
- 100% Waterproof, Ruggedized, Covert Mount: Built for equipment that works outside for a living.
Pricing, Against a $47,000 Claim
You can put AlerTrax on your entire fleet for a low monthly rate, with no long-term contracts and no hidden fees. Set that against the average workers' compensation claim of $47,316, or against a single truck sitting in a body shop during peak season, and the arithmetic does not need much help.
(Want to own it outright? There is a $599 one-time Lifetime option for permanent, subscription-free tracking. No fees, ever.)
See the monthly plan and get set up here.
And the Other Way a Truck Disappears
A crash is one way to lose a truck for a week. Theft is the other. Geofence your yard and AlerTrax alerts you within minutes of after-hours movement, with tamper notifications on the device and a live tracking link you can hand to law enforcement. Same hardware, second job.
Manage the Drive Like It Is Part of the Job
Because it is the most dangerous part of it. Transportation incidents have been the leading killer of American workers for years, employer crash costs have climbed more than half in six years, and grounds maintenance deaths went up in a year when the national number went down. Meanwhile the single biggest lever most owners have never pulled is simply asking their trucks to drive fewer unnecessary miles.
Visit www.buyalertrax.com, put a tracker on every truck, and start managing the miles between jobs as carefully as you manage the work at them.
This article is for general informational purposes only and is not legal, safety, insurance, or compliance advice. AlerTrax is a location and asset-tracking system. It is not a collision avoidance system, a driver-monitoring or coaching platform, or a substitute for a fleet safety program, driver training, vehicle maintenance, or appropriate insurance coverage. Consult qualified safety, insurance, and legal professionals regarding your specific obligations and exposure.
Sources
U.S. Bureau of Labor Statistics, Census of Fatal Occupational Injuries, 2024 (released February 19, 2026): 5,070 fatal work injuries in 2024, a rate of 3.3 per 100,000 full-time equivalent workers and a 4 percent decrease from 2023; one worker death every 104 minutes; transportation incidents the most frequent fatal event at 1,937 deaths, or 38.2 percent of all occupational fatalities; 1,146 roadway incidents involving motorized land vehicles; fatalities among building and grounds cleaning and maintenance workers rose to 356 in 2024 from 337 in 2023.
Network of Employers for Traffic Safety (NETS), Cost of Motor Vehicle Crashes to Employers, developed under a cooperative agreement with the National Highway Traffic Safety Administration: U.S. traffic crashes cost employers $72.2 billion in direct crash-related expenses including medical care, liability, lost productivity, and property damage, up from $47.4 billion six years earlier; employer costs per employee were highest in trucking, special trades construction, local and inter-urban transportation, and oil and gas extraction.
National Safety Council, Injury Facts: Average workers' compensation claim cost of approximately $47,316; total cost of work injuries in the United States of $181.4 billion in 2024.